Use Case
Grids can be great for reporting and gaining quick insights into your data, especially with features like row summaries. With column summaries, you can add numerical summaries to your grids.
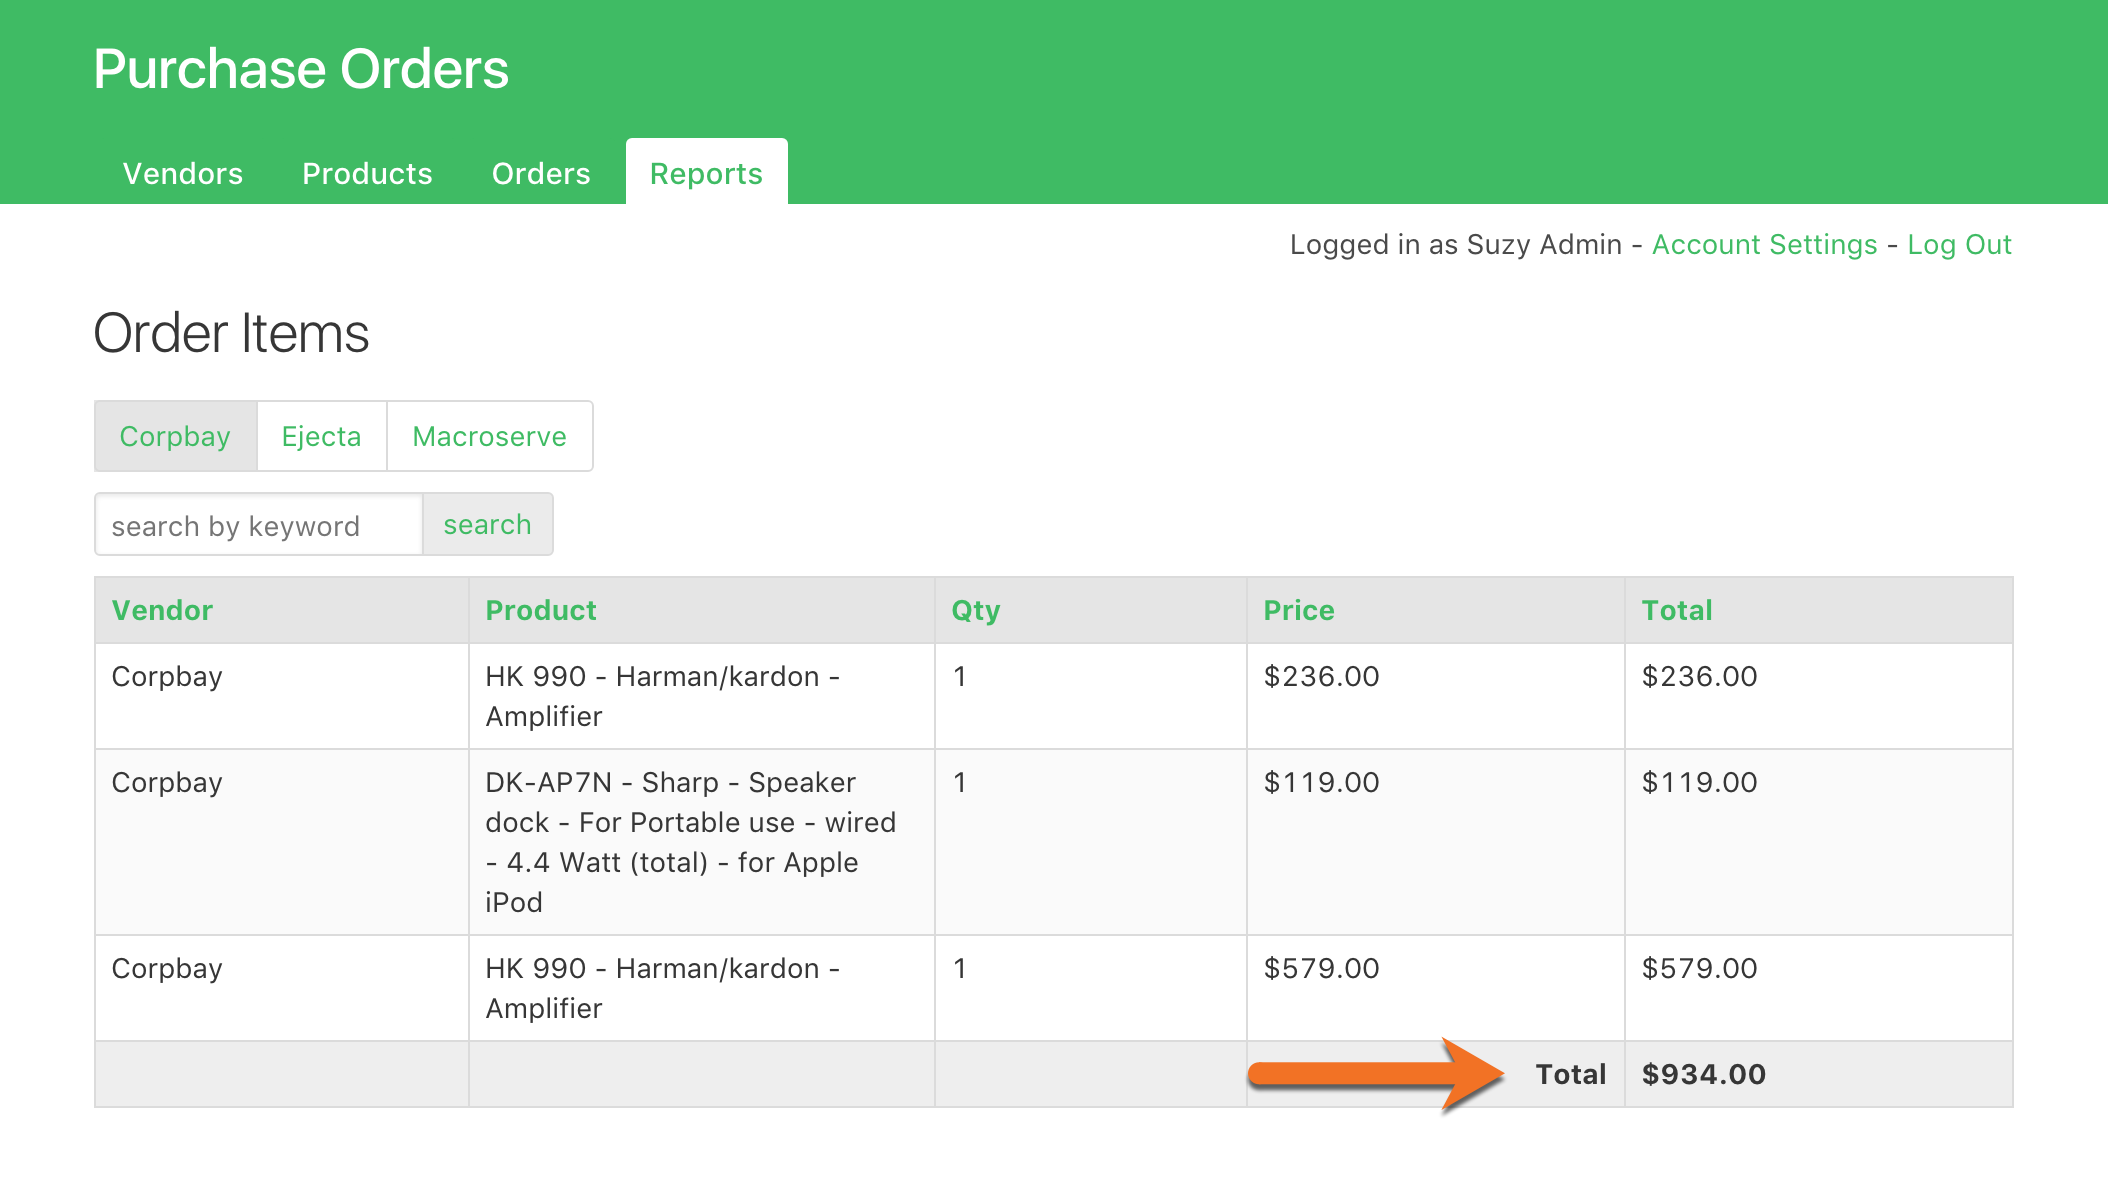
For example, we have an Order Items report that includes the amount spent on each order item. To see the total amount spent on all order items, we’ve added a sum row summary named “Total” to the grid:
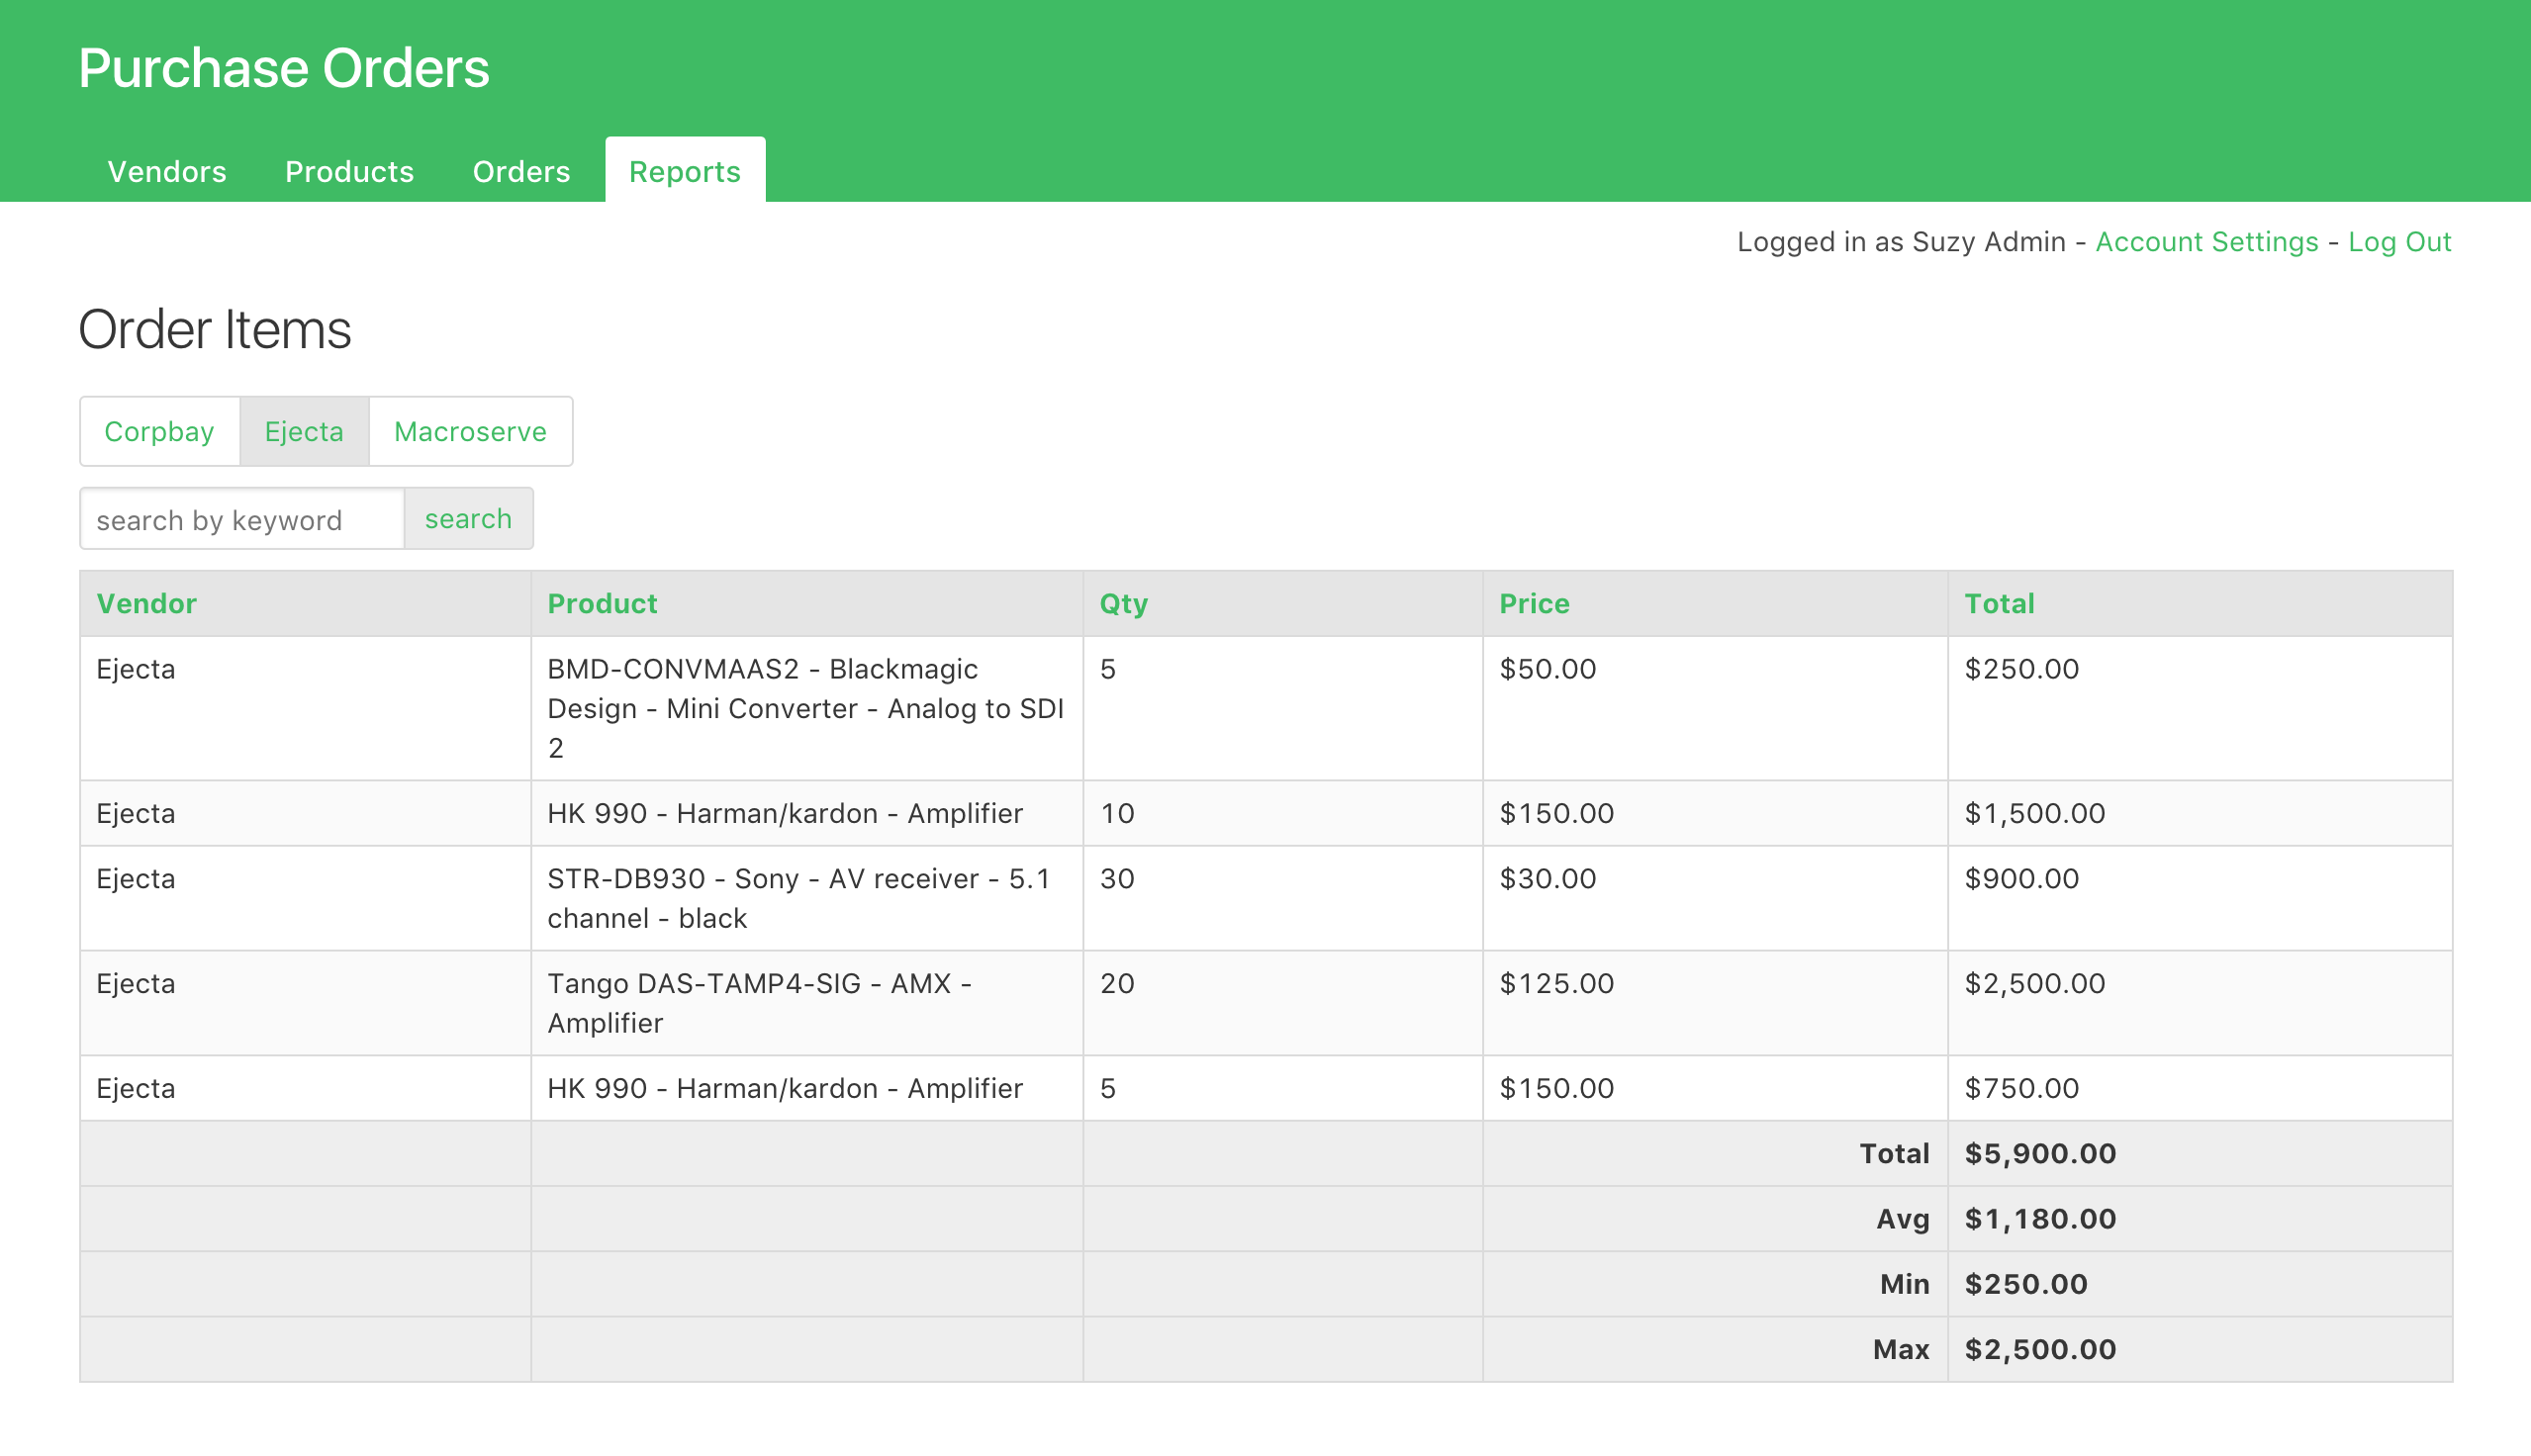
To get more insights, we added row summaries to see the average, minimum, and maximum amounts spent on order items:
For more features on using grids as reports, try out grouping or display rules that add color and icons to your grids.
Requirements
Steps
Select the Page with the Grid
In the Pages section of the Builder, select the page that holds the grid you want to add row summaries to.
Open the Grid Editor
Click on the grid view on the page preview to open the editor.
Go to the Settings Section
In the view editor, go to the Settings section and click the “Add Summary” link below the Column Summaries:
Choose a Summary Option
Select whether you want to summarize the sum, average, maximum, or minimum of the values and rename the label on the left as you like:
Add More Row Summaries
To add more row summaries, click on the “plus” icon. You can add as many row summaries as you need:
Disable Row Summaries for Certain Columns
When column summaries are enabled, any numeric columns will automatically be summarized. However, if there are columns that you don’t want to be summarized, you can specify that.
For example, in the grid below, three columns are being summarized: Qty, Price, and Total. However, we only want the Total column to be summarized.
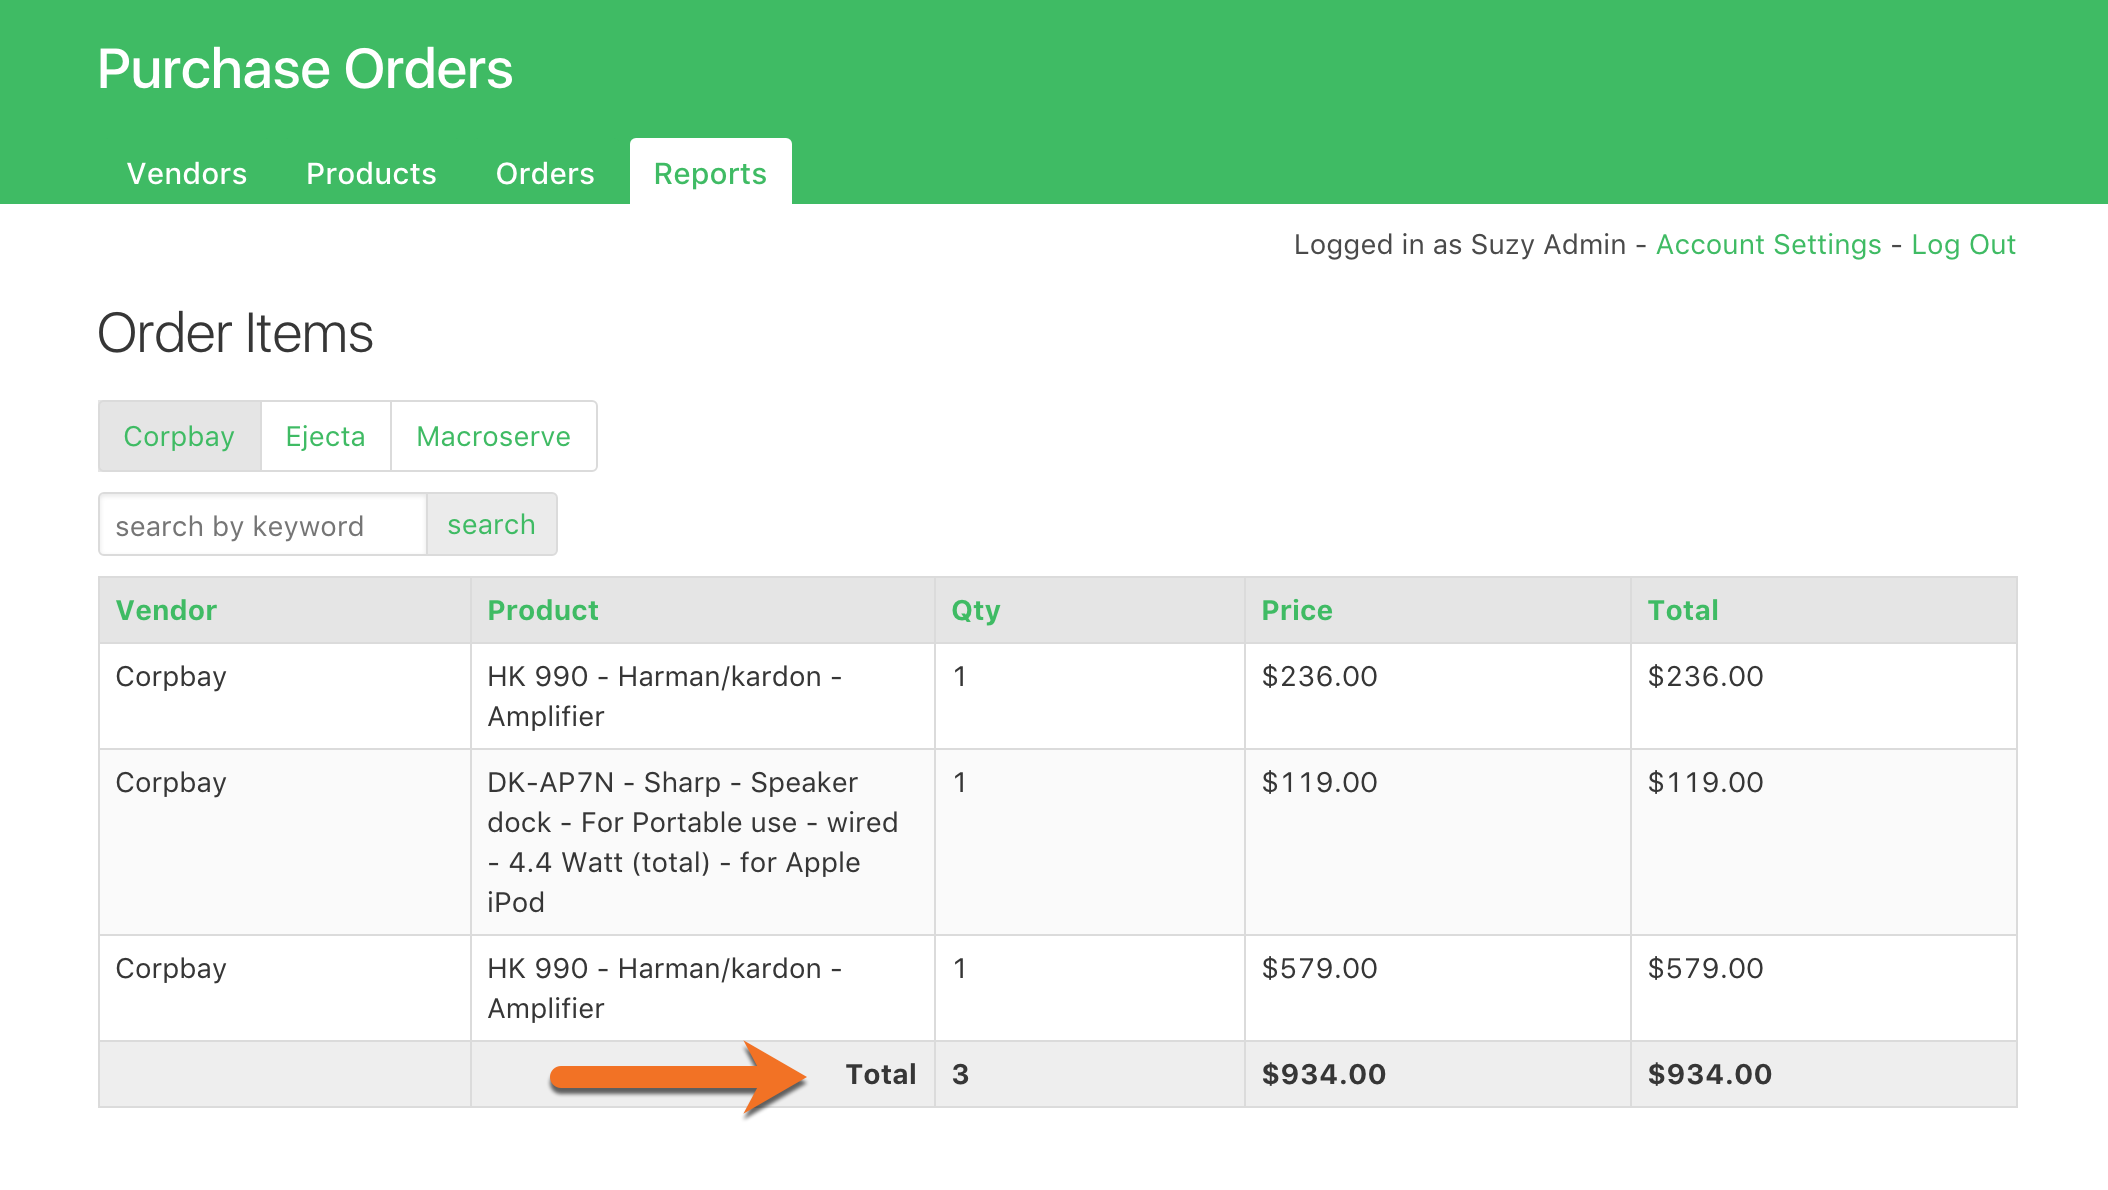
To remove the summary from the Qty and Price columns, hover over the Qty column and click the edit pen icon to edit that column:
Then, we’ll set the “Allow Summary” property to No:
That process can be repeated for any columns that shouldn’t be summarized.