This article covers the following topics:
What are reports?
Reports are a powerful tool that enables you to effortlessly group the records in your tables and present them visually as eye-catching charts or graphs. This allows you to easily identify trends and make valuable comparisons based on calculations.
A great example of this can be seen in our Donations Manager sample app. In this app, you can view a pie chart that displays how much money each event was able to raise compared to all of the money raised as a whole, a pivot table that displays the total amount donated for each event, and a line graph that tracks how much was donated on each date.
/About%20Reports/reports1.webp?hsLang=en)
What do reports look like in a Live App?
Knack currently offers five types of reports: Pivot Tables, Pie Charts, Line Charts, Bar Charts, and Area Charts.
Here is a brief overview of the various report types available in Knack:
Pivot Tables
Pivot tables show calculations based on two groupings, rows and columns:
/About%20Reports/reports2.webp?hsLang=en)
Pie Charts
Pie charts show calculations as percentages of the whole based on a single grouping:
/About%20Reports/reports3.webp?hsLang=en)
Line Charts
Line charts show calculations as a plotted line based on a single grouping:
/About%20Reports/reports4.webp?hsLang=en)
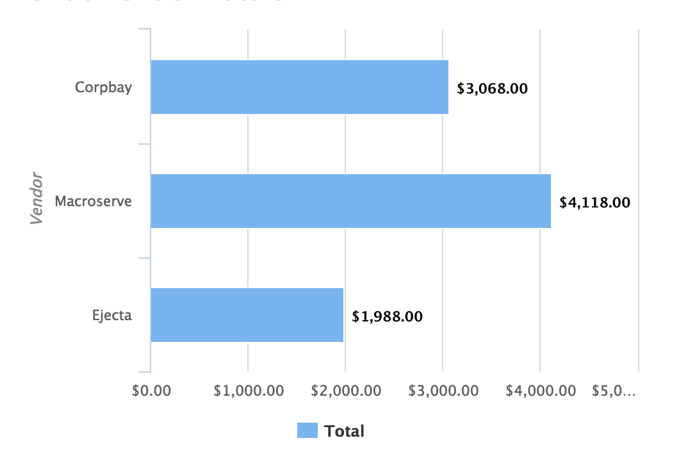
Bar Charts
Bar charts show calculations as bars based on a single grouping:
Area Charts
Area Charts fill in the area below the data points on a line chart and can help to visual trendlines:
/About%20Reports/reports6.webp?hsLang=en)
Area charts can be set up in the following ways under the Report > Layout Tab.
-
A basic area chart shows a comparison between the spending of each department by displaying the values overlapped on a single plane
-
A normal stacked area chart shows how much each department contributed to overall spending while showing the cumulative spending over time
-
Percentage stacked area chart shows the percentage of spending by each department relative to 100% of the total
Managing Reports
Adding and deleting report views are managed the same as other view types. To learn how to add and delete report views from your app, see our article About Views.
Editing Report Views
Modifying a report view is slightly different from editing other views. With a single report view, you have the ability to include multiple charts.
To edit a report, simply click on the pen icon in the page preview. This will allow you to modify the title or description, as well as add a new chart to the report view.
/About%20Reports/reports7.png?hsLang=en)
Editing Individual Charts
To make changes to individual charts, simply hover over the chart in the page preview and click on the pen icon. This will open the settings for that specific chart, allowing you to customize the source, group the records, add options and filters and manage the layout.
/About%20Reports/reports8.png?hsLang=en)
Report Settings
In the report settings, you can easily manage the title and descriptions of the chart grouping. Additionally, you can add extra charts to the report view.
Title & Description
In the Chart Properties of a report, you will come across the Layout & Design section. Here, you have the option to modify the Title and Description of the report you are currently editing.
/About%20Reports/reports9.png?width=688&height=407&name=reports9.png)
Adding Charts
To incorporate charts into your report view, simply click on the pen icon and navigate to the "Add Charts" section. From there, you can choose the specific type of report you wish to include.
/About%20Reports/reports10.png?hsLang=en)
Chart Properties
When you add a new report or edit an existing one, you will have access to the settings toolbox. This toolbox allows you to configure the settings for your chart.
Chart Properties include five tabs: Source, Data, Options, Filters, and Layout & Design.
Source
The Source tab allows you to determine which records will be displayed in your report. Here, you have the option to add source filters that will limit the records shown in the report.
/About%20Reports/reports11.png?hsLang=en)
Source filters do not eliminate rows from a report. Instead, they filter the records that are included in each row's calculations.
For example, if you add a data source filter for "Type is Business" and exclude business records, they will still be displayed in the report, but their calculations will be 0. To hide the empty row from view, you can enable the option to exclude empty groups in the settings (see options settings below).
Tip: You can learn more about using a view’s Source here.
Data
Groupings and Calculations
The Data section provides you with the flexibility to define how your records will be grouped and the calculations that will be displayed in your report. The available options may vary depending on the report type you choose.
/About%20Reports/reports12.png?hsLang=en)
Note: Equations cannot be utilized as rows or columns in pivot tables; however, they can be applied in calculations.
When creating a report, it is important to decide how you want to group your records and what calculations you want to include for each group. For bar, line, and pie charts, you will be allowed to select the chart grouping and add a calculation.
Data Options
-
How will the chart group the records?
-
Bar charts, line charts, and pivot table report types can have one or more groupings. However, pie charts can only have one grouping.
-
-
What will the chart calculate for each group of records?
-
Calculations can include a record count or a sum, average, minimum, or maximum of any numeric field. Pivot tables, line, and bar charts can include more than one calculation.
-
Note: Additional groupings and calculations can be added to bar charts, line charts, and pivot table report types by selecting the "+" button next to the current group or calculation.
Knack gives you the option to further filter your groupings when using connection fields and date/time fields.
By clicking on the gear icon next to the grouping or calculation, a popup will appear, providing you with the ability to customize field labels, sort or group your records, apply filters, and specify which records you want to display.
Keep in mind that the available options may vary depending on the field types used.
/About%20Reports/reports13.png?hsLang=en)
Notes:
- When you click on the "Options" link on a calculation row, a window will open that allows you to filter the values used in your calculation.
- Record filters do not remove rows from a report. The record is still returned as an axis label on the graph, but any reporting numbers will not include records excluded by those filters.
- To remove the empty row from the view, you will need to enable the "Exclude empty groups" option.
Summaries
In pivot tables, you have the option to include column and row summaries if multiple calculations are used. These summaries can be added in the "Summaries" section of the report editor.
/About%20Reports/reports14.png?hsLang=en)
Note: Row Summaries only work with two or more calculations. To use this feature, you will need to add another Pivot Calculation.
Options
The Options section contains extra features that you can add to further customize your reports.
/About%20Reports/reports15.png?hsLang=en)
The following options are available to further customize your reports:
-
Exclude Empty Groups: This option removes groupings from your report if they have no value (0).
-
Show/hide data table: This option hides negative ranges from your report.
-
Click to Expand Group Records: This feature allows users to click on report groupings to view more details about the grouping in a popup.
-
Allow Print & Export Options: This option adds the Print and Export feature to your report.
-
Please note that this option is not available for pivot tables.
-
Filters
The filters section gives you the ability to manage how your users can filter the displayed records in the chart.
/About%20Reports/reports16.png?hsLang=en)
The following options are available to select in the Filters section:
-
Don't allow records to be filtered: This will remove the filter option from your report.
-
Enable users to filter records: This will give users the ability to add filters to your report. You can choose whether or not you want them to be able to filter based on the fields present in the report or all fields in your table.
-
Use a filter menu: This option will allow you to create predesignated filters that users can use to filter records on the page.
Layout & Design
Under the Layout tab, you have the option to personalize the appearance of your report even more.
/About%20Reports/reports17.png?width=688&height=391&name=reports17.png)
In the layout section, you can:
-
Edit the title and description of your report
-
Change the location of the legend
-
Customize the length and width dimensions of your report
Using Reports in Your App
Knack gives you multiple options to view and analyze your data in meaningful ways. To learn more about including reports in your app's workflow, check out our article Reporting & Dashboards.
Notes & Troubleshooting
Calculation limits
Our reports feature currently does not support calculations for record counts over 10,000 records. You could potentially display more than 10,000 records in a report, but each summation is limited to 10k records for its grouping.
If your source table has over 10,000 records, we advise adding filters to your view source to get the total record count under 10,000.
Tip: Learn more about using the view source here.
Grouping limits
-
Every report has a grouping limit (the number of "cells" rendered) of 3,000 records. If you see an error when building your report, you will need to add filters to your groups to get the total number below 3,000 groups.
-
Here is how groupings are calculated:
(# of unique records in each row) * (# of records in columns (if any)) * (# of calculations) -
Example: 100 orders and 3 vendors, and you calculate the total number of records AND order total =
100 * 3 * 2 = 600 groupings.
-
-
Source filters do not restrict report groupings, as they are applied after the groups render. So, if you need to shave the number of groupings down to meet the 3,000 record limit, you will need to filter your report groupings.
-
Filter options for groupings are only available for connection fields and date/time fields.