In this article, we'll guide you through the essential process of planning your tables, which is a crucial aspect of any Knack app. We'll provide you with helpful tips, best practices, and answers to common questions that both beginners and experienced Knack users may have about tables.
First, let's start by discussing some fundamental concepts about tables in Knack. After that, we will guide you through the planning process.
Requirements
If this is your first time creating an app, you'll need to know some basics about adding tables, fields, pages, and views. You can start by reading our Builder Basics section.
Other good resources can be found in our About Your Database and Working With Pages articles in the knowledge base.
There are other articles in this series you can read before or after this article:
Steps
Understand Tables and User Roles
Tables are used to organize and group information, which represents your data. It is important that each table represents only one type of information, as it contains properties that identify a specific type of item.
For instance, if you wish to monitor events, you will need to create an Events table. This table will bring together data that describes your events, such as the event name, date, location, and description.
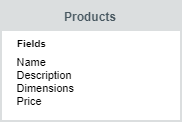
Similarly, a Product table will group data that describes your products, including the product name, description, dimensions, and price.
User roles are essential for managing access and permissions in your Live App. They provide specialized permissions for users to log in and access specific data tailored to their role.
User roles are similar to tables, as they group data together, but they also include additional permissions.
User roles are used to define the different types of users who will access your app, such as Employees and Managers. By assigning roles, you can create pages where Employees can only view their own assessments, while Managers have access to view all the assessments of their assigned Employees.
Tip: If you’re coming from an Excel or Access/SQL background, you can think of a table like a spreadsheet or a database table.
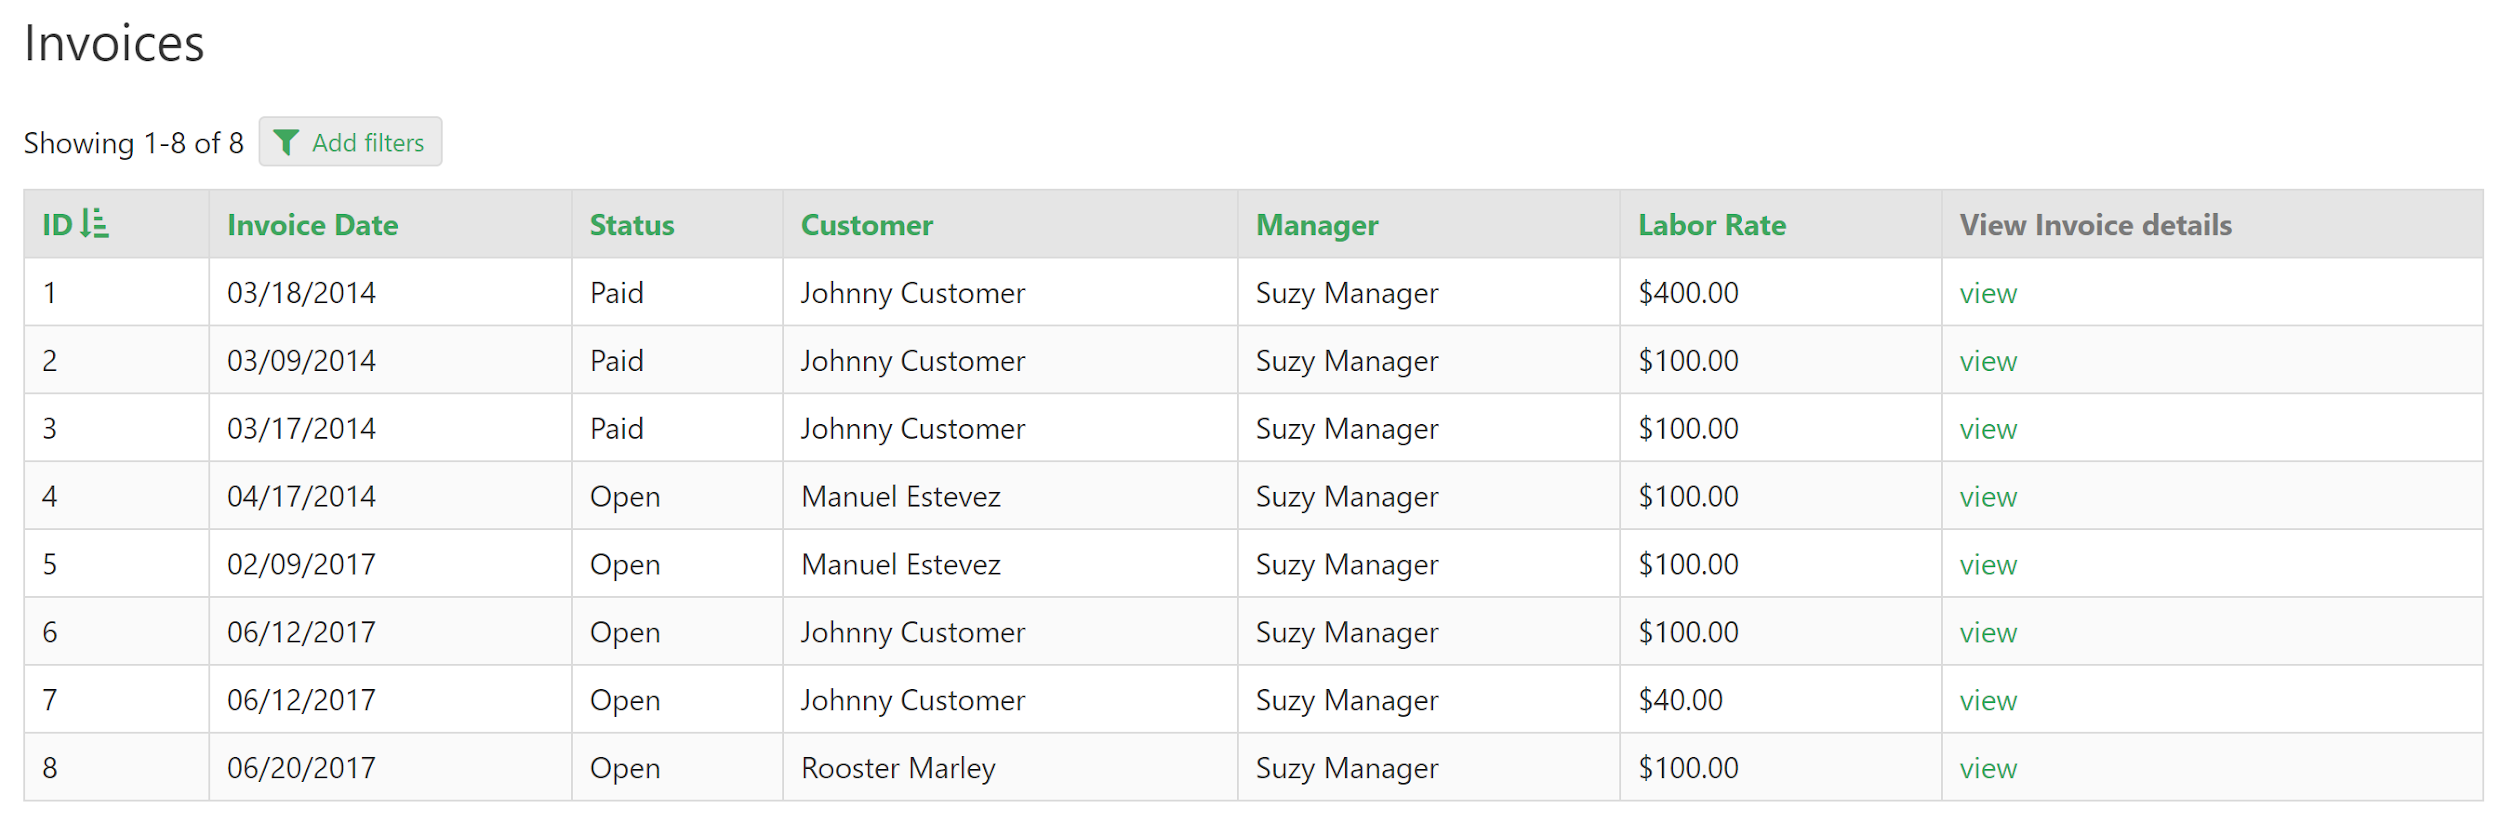
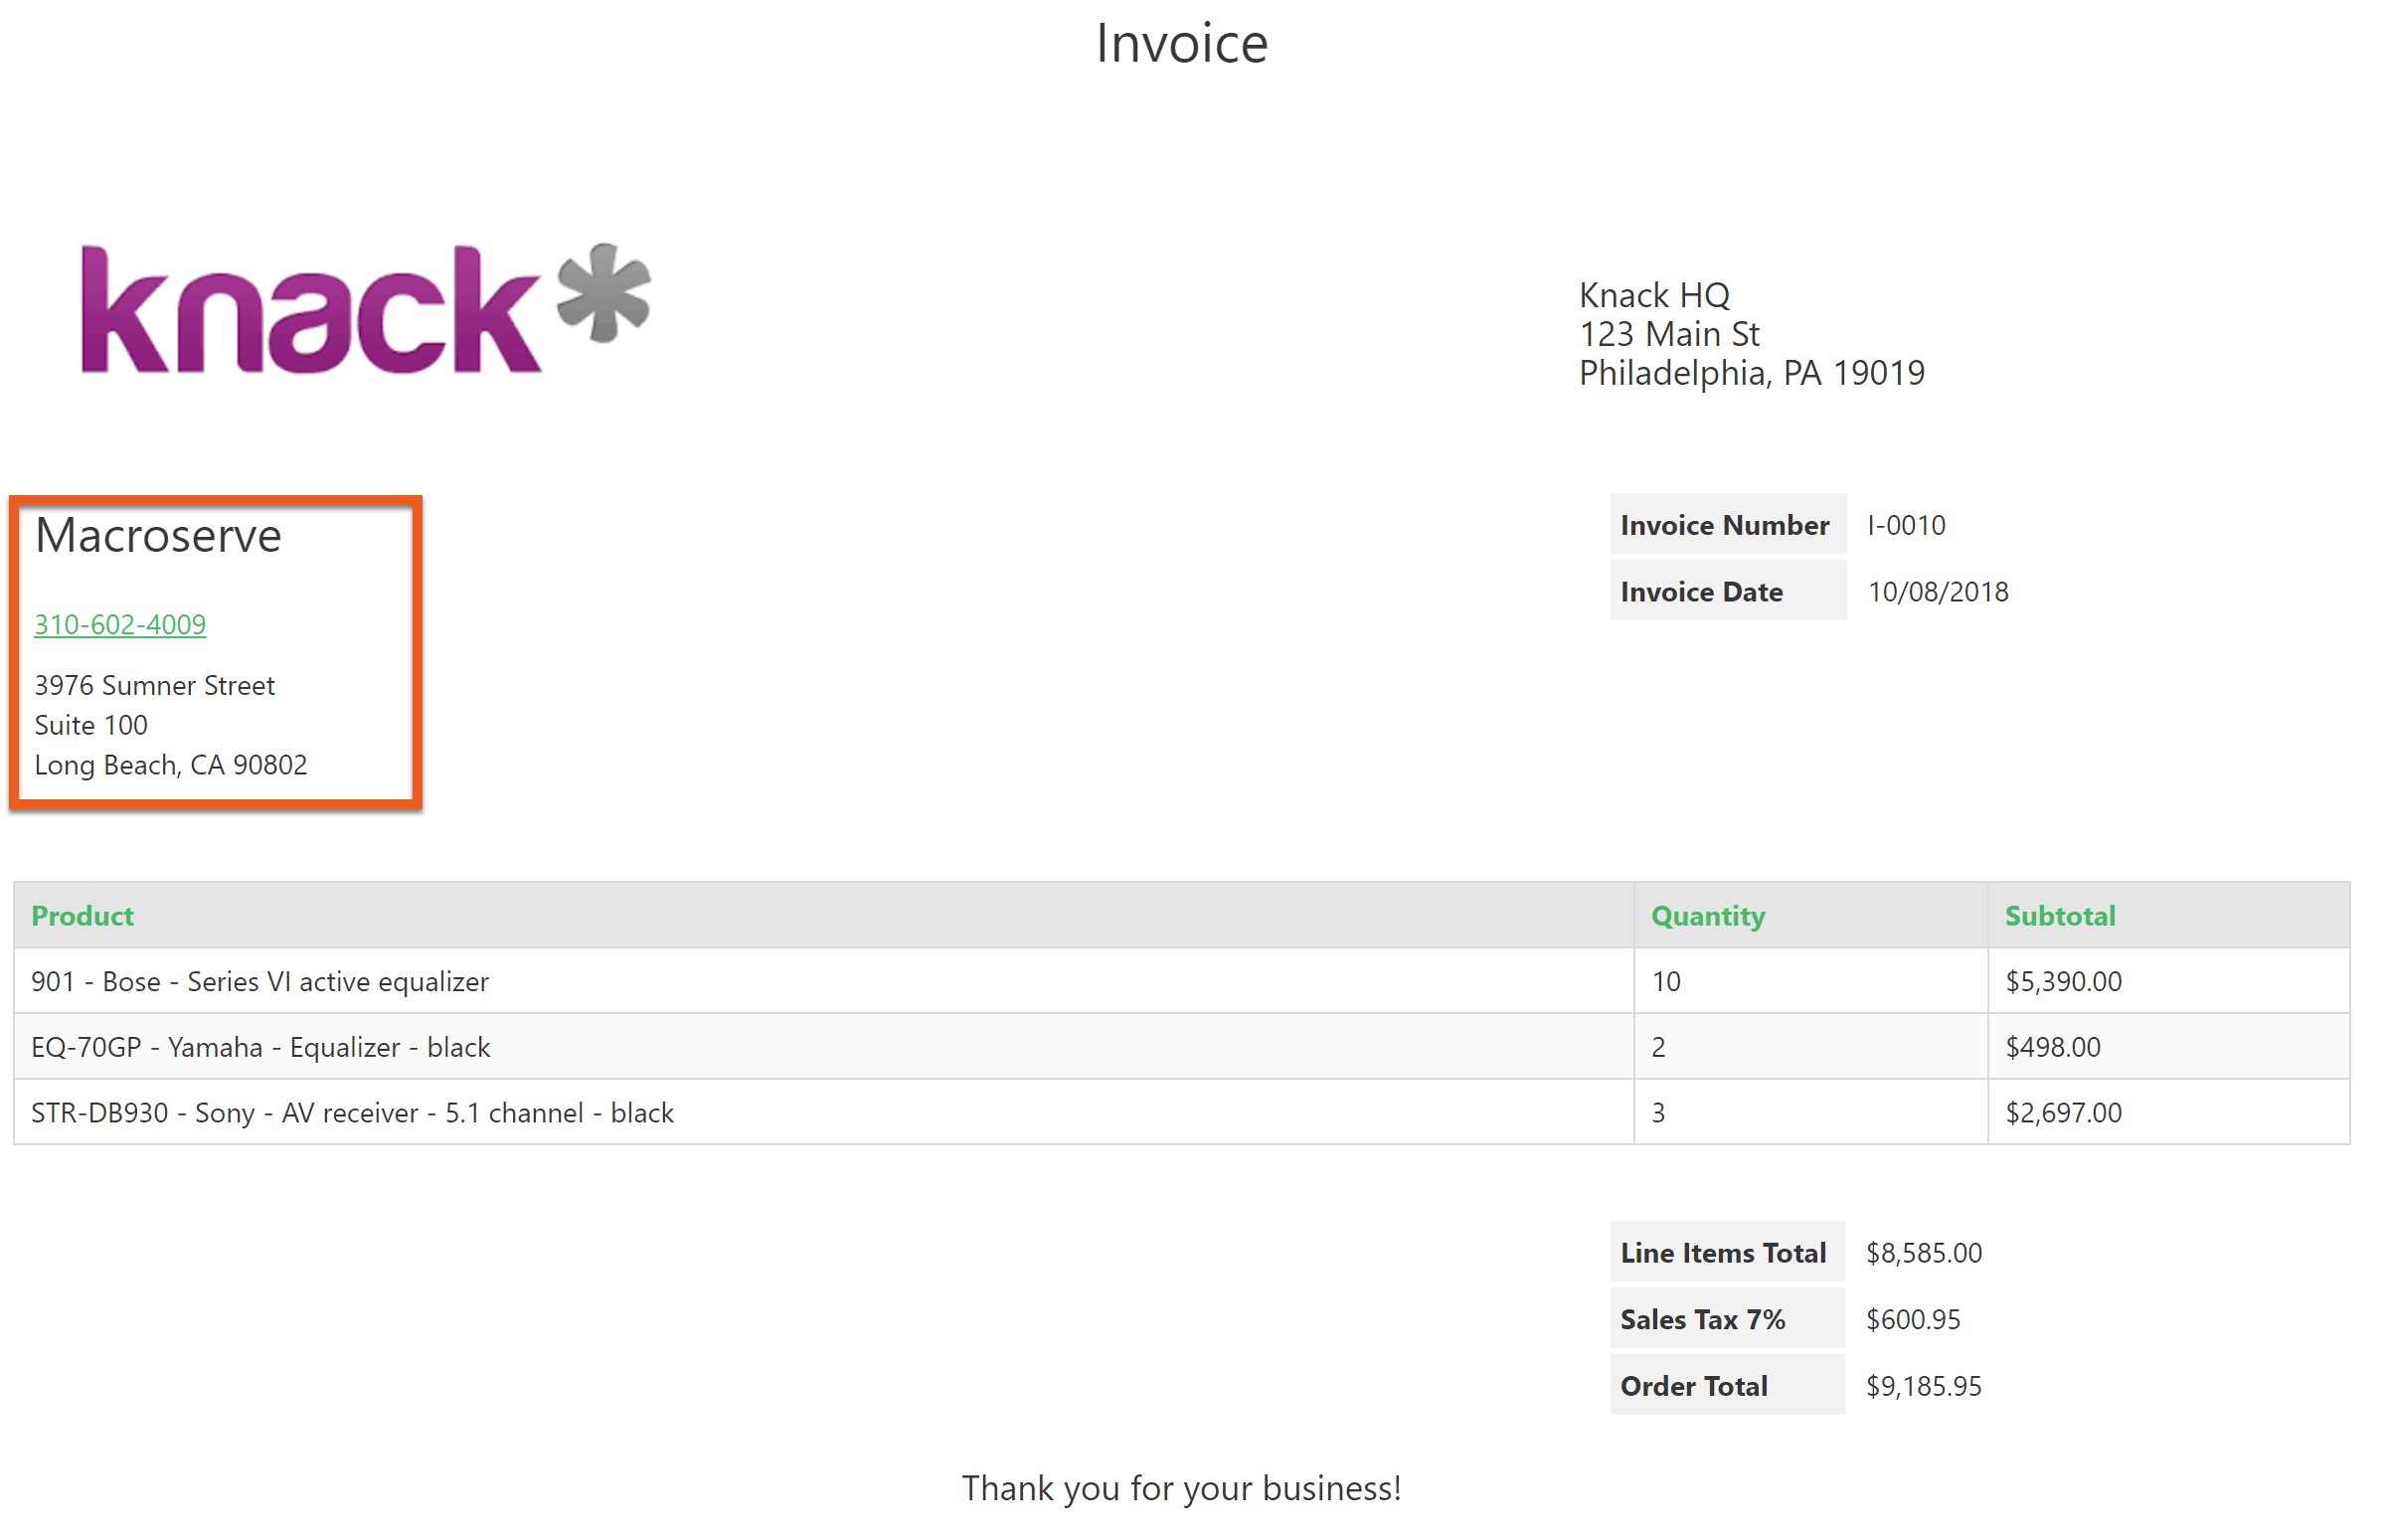
Let's explore an example to understand the distinction between user roles and tables. In a customer portal application, it may be necessary to track invoices and customers.
While customer data such as address or phone number is important to display on an invoice, it doesn't specifically identify the invoice itself. Instead, it identifies the customer.
Therefore, it is advisable to separate these two different types of data into separate tables.
When a table for invoices includes both order data and customer data, it no longer represents a single type of information. This can lead to the need to maintain customer data in two different places, which can make data management more complex and increase the likelihood of inaccuracies.
This article aims to provide guidance on how to avoid this issue.
You can use connections to associate customer data with each invoice. This allows each table to have a single grouping of information, which consists of fields that specifically identify that table.
Continue reading to learn more about connections. Later in this article, we’ll explore the difference between tables and user roles in greater detail.
Understanding Fields
Fields are the individual pieces of data that make up a table.
Each field is specifically formatted based on the type of data it contains.
For instance, address fields are equipped with sub-fields for street address, city, state, and country. File fields provide the option to upload or link to documents.
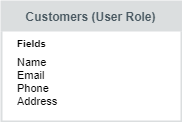
Every table consists of fields that define the data within it. For instance, the "Customers" user role includes fields for the customer's name, phone number, and address, in addition to the default user role fields like password, role, and status.
Connection fields are a unique field type that is generated when we establish a connection between two tables. This connection field establishes a relationship between the two tables, enabling us to share and associate data between them.
Once we connect Invoices to Customers, a connection field for Customers will be added to the Invoices table.
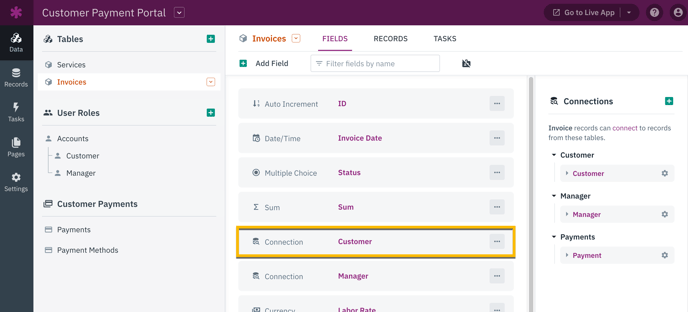
The connection field allows you to display the "Customers" records in a searchable dropdown. By default, it shows values from the first field in the Customers table, but you have the option to customize this setting.
This field is known as the display field, and you can easily modify it in the settings of each table.
See our guides About Fields and Field Types for more information.
Understanding Records
Records are the actual data in your app. If you're familiar with spreadsheets, you can think of a record as a single row.
Each column represents a field, and the entire sheet represents a table.
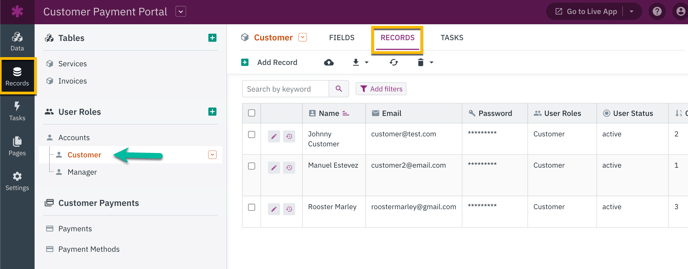
In the "Customers" user role, we will create a separate record for every individual customer. This record is where all the actual data will be stored.
Understanding Connections
Connections are represented as a unique field type in Knack. By using connection fields, you can establish relationships between tables that store different types of data in your app.
These connections enable you to create associations between records without the need to manage primary and foreign keys, links, or joins.
If you have experience with other database solutions, you might be familiar with the use of primary and foreign keys, links, or joins to establish relationships.
Note: In Knack, there is no need to handle primary and foreign keys. Instead, you can simply use the connection field to link your records together.
Connections offer a range of capabilities that can greatly enhance your app functionality:
-
View related data: You have the ability to establish connections between your data, allowing you to easily view information about a company and its associated contacts, for example.
-
Ensure users only have access to their own data: Restrict the data visible to users on a page, ensuring that they only have access to the data that is pertinent to them. In doing so, customers will only be able to view the orders they have personally created upon logging in.
-
Run calculations and visually summarize your data: Generate reports that display the overall sales generated in a specific month and even the individual contributions of each salesperson towards that total.
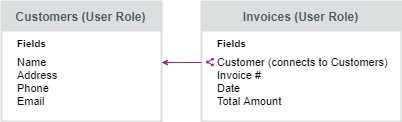
In a customer portal app, we will connect our Invoices table to our "Customers" user role so each invoice in our database is linked to the customer it belongs to.
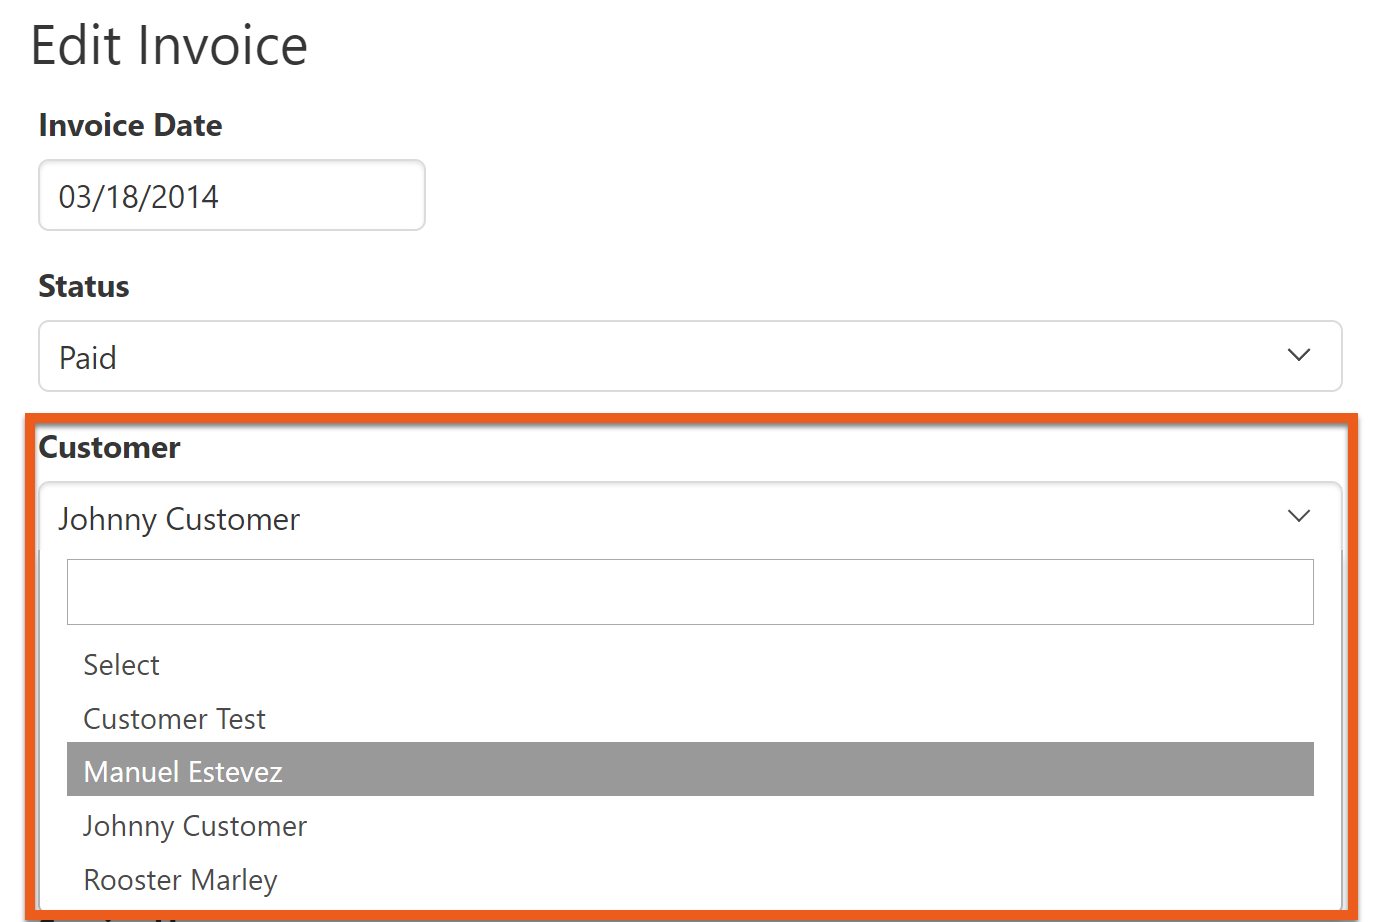
The connection field in each "Invoices" record displays only one field from the connected "Customers" record, which is the name field. However, since they are connected, we have the ability to access all the data from the connected record in our Live App.
For example, we can create an invoice page in our Live App that displays the invoice date, number, and total, along with data from the connected customer - name, address, phone number, and more. You can learn more about this in the Optional Functionality section of this guide.
Tip: See our guide Connect Related Data for more examples of how connections are leveraged to create powerful Knack apps
Thinking About Your App
Now is an opportune time to begin documenting the goals of your application:
-
Who will be using it?
-
What will they need to access?
-
Do I have different groups of users with different access levels?
-
What kind of data will my users be entering in my app? What kind of data do I want to share with them?
-
Do I need any special formatting or field types for my data?
Tip: See our guide on Users & Access for ideas on what you can do with users in Knack. Our Workflow and Reporting guides also provide many examples of what your users can do in your app.
Use the guides above and your own project idea to start creating your app plan. You’ll use this plan to determine what tables and user roles you will need.
Tip: Creating an outline before you start building your app can be incredibly helpful! You don't need to have a fancy proposal or a detailed flowchart.
By simply writing everything out, you can save a lot of time. Check out the next step for a basic example.
Mapping Out Your Fields, Tables, and User Roles
Now that you have a solid understanding of the fundamentals and have a clear vision for your application's functionality, it's time to plan and organize your data.
Let’s say we want to create a project management application. In this app, we need to track a few things:
-
Details about the project, including goals, project manager, client, and budget.
-
The time spent on and expenses incurred for each project for cost analysis and billing.
-
Multiple tasks and milestones for each project, with different deadlines and people assigned to each item.
-
Details about the client and contacts at each company.
Furthermore, there are several distinct user groups that will require access to the application:
-
Admins need access to manage the client database by adding and editing client records. They also add new projects and assign a project manager.
-
Project managers need to access their own projects, create and assign tasks, and view and edit project details. They also need to manage costs related to their projects.
-
Employees need to view the tasks they are assigned to and update those tasks. They also need to track how much time they spend on their assigned tasks.
Now, let’s begin breaking down this basic app outline into individual tables and user roles.
Tip: Use easy-to-understand, plural names for your tables. If you are used to using SQL databases, you may use naming conventions like invoice_tbl.
Because of the way Knack uses table and field names in the Live App, it’s usually easier and more human-readable to name your table "Invoices" instead.
Tables
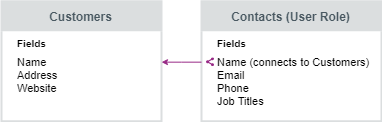
To begin, let's focus on gathering Client data. Our goal is to collect information about client companies and have the ability to record multiple contacts for each client.
This implies that we are recording two distinct types of data in this case: company data and contact data.
By creating separate tables for Clients and Contacts, we effectively segregate the different types of data. By establishing a connection from Contacts to Clients, we enable access to Client data from each corresponding Contact record.
Let’s map out our Client and Contacts tables and their fields:
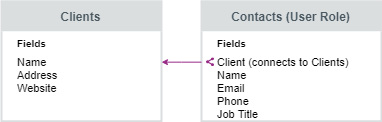
This graphic shows our Clients and Contacts tables, with the connection between them represented by the arrow Client connection field in "Contacts".
Next, let's delve into our Project data. Projects consist of various types of information: details that define the project itself (such as project name, client, project manager, and description) and data that pertains to the work carried out for the project (including tasks, expenses, milestones, and more).
We’ll need to break these data types out into tables in order to achieve the desired functionality in terms of access, workflow, and reporting.
To start, we will create a Projects table that holds the essential project data. Additionally, we will create tables to track other project-related information:
-
Tasks: These tasks are integral to the project and contribute towards its completion. Each task is connected to a specific milestone, and project managers assign employees to handle each task.
-
It is important for us to keep track of the time spent by each employee on their assigned tasks.
-
-
Milestones: Project milestones are critical points in a project's timeline. They are set with specific deadlines and deliverables by project managers.
- Our goal is to track the tasks associated with each milestone and the amount of time dedicated to achieving them.
-
Hours: This is the section where employees can track the time they allocate to their assigned tasks.
-
Costs: This is the section where the project manager keeps a record of any costs incurred for materials related to their projects.
To ensure that all data is properly tracked to the right project, it is necessary to establish connections between these tables. However, the details of how to make these connections will not be covered in this article.
Tip: For more information on planning connections, please refer to the articles linked above in the Requirements section.
Now, let's outline the tables and fields related to our projects:
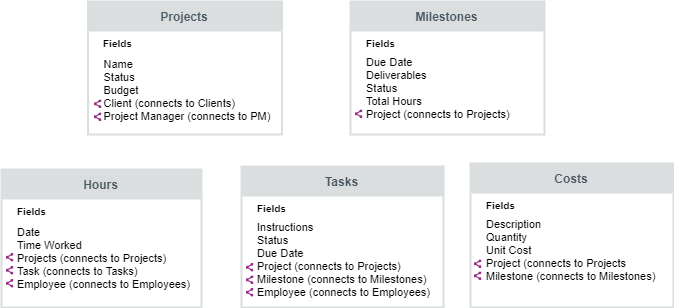
Note: The diagram above illustrates the tables related to our projects, along with their key fields. The connection fields are easily identifiable by the connection icon to the left of the field name.
Besides keeping our data easier to manage, using separate tables for these different data types also opens up some powerful app functionality:
-
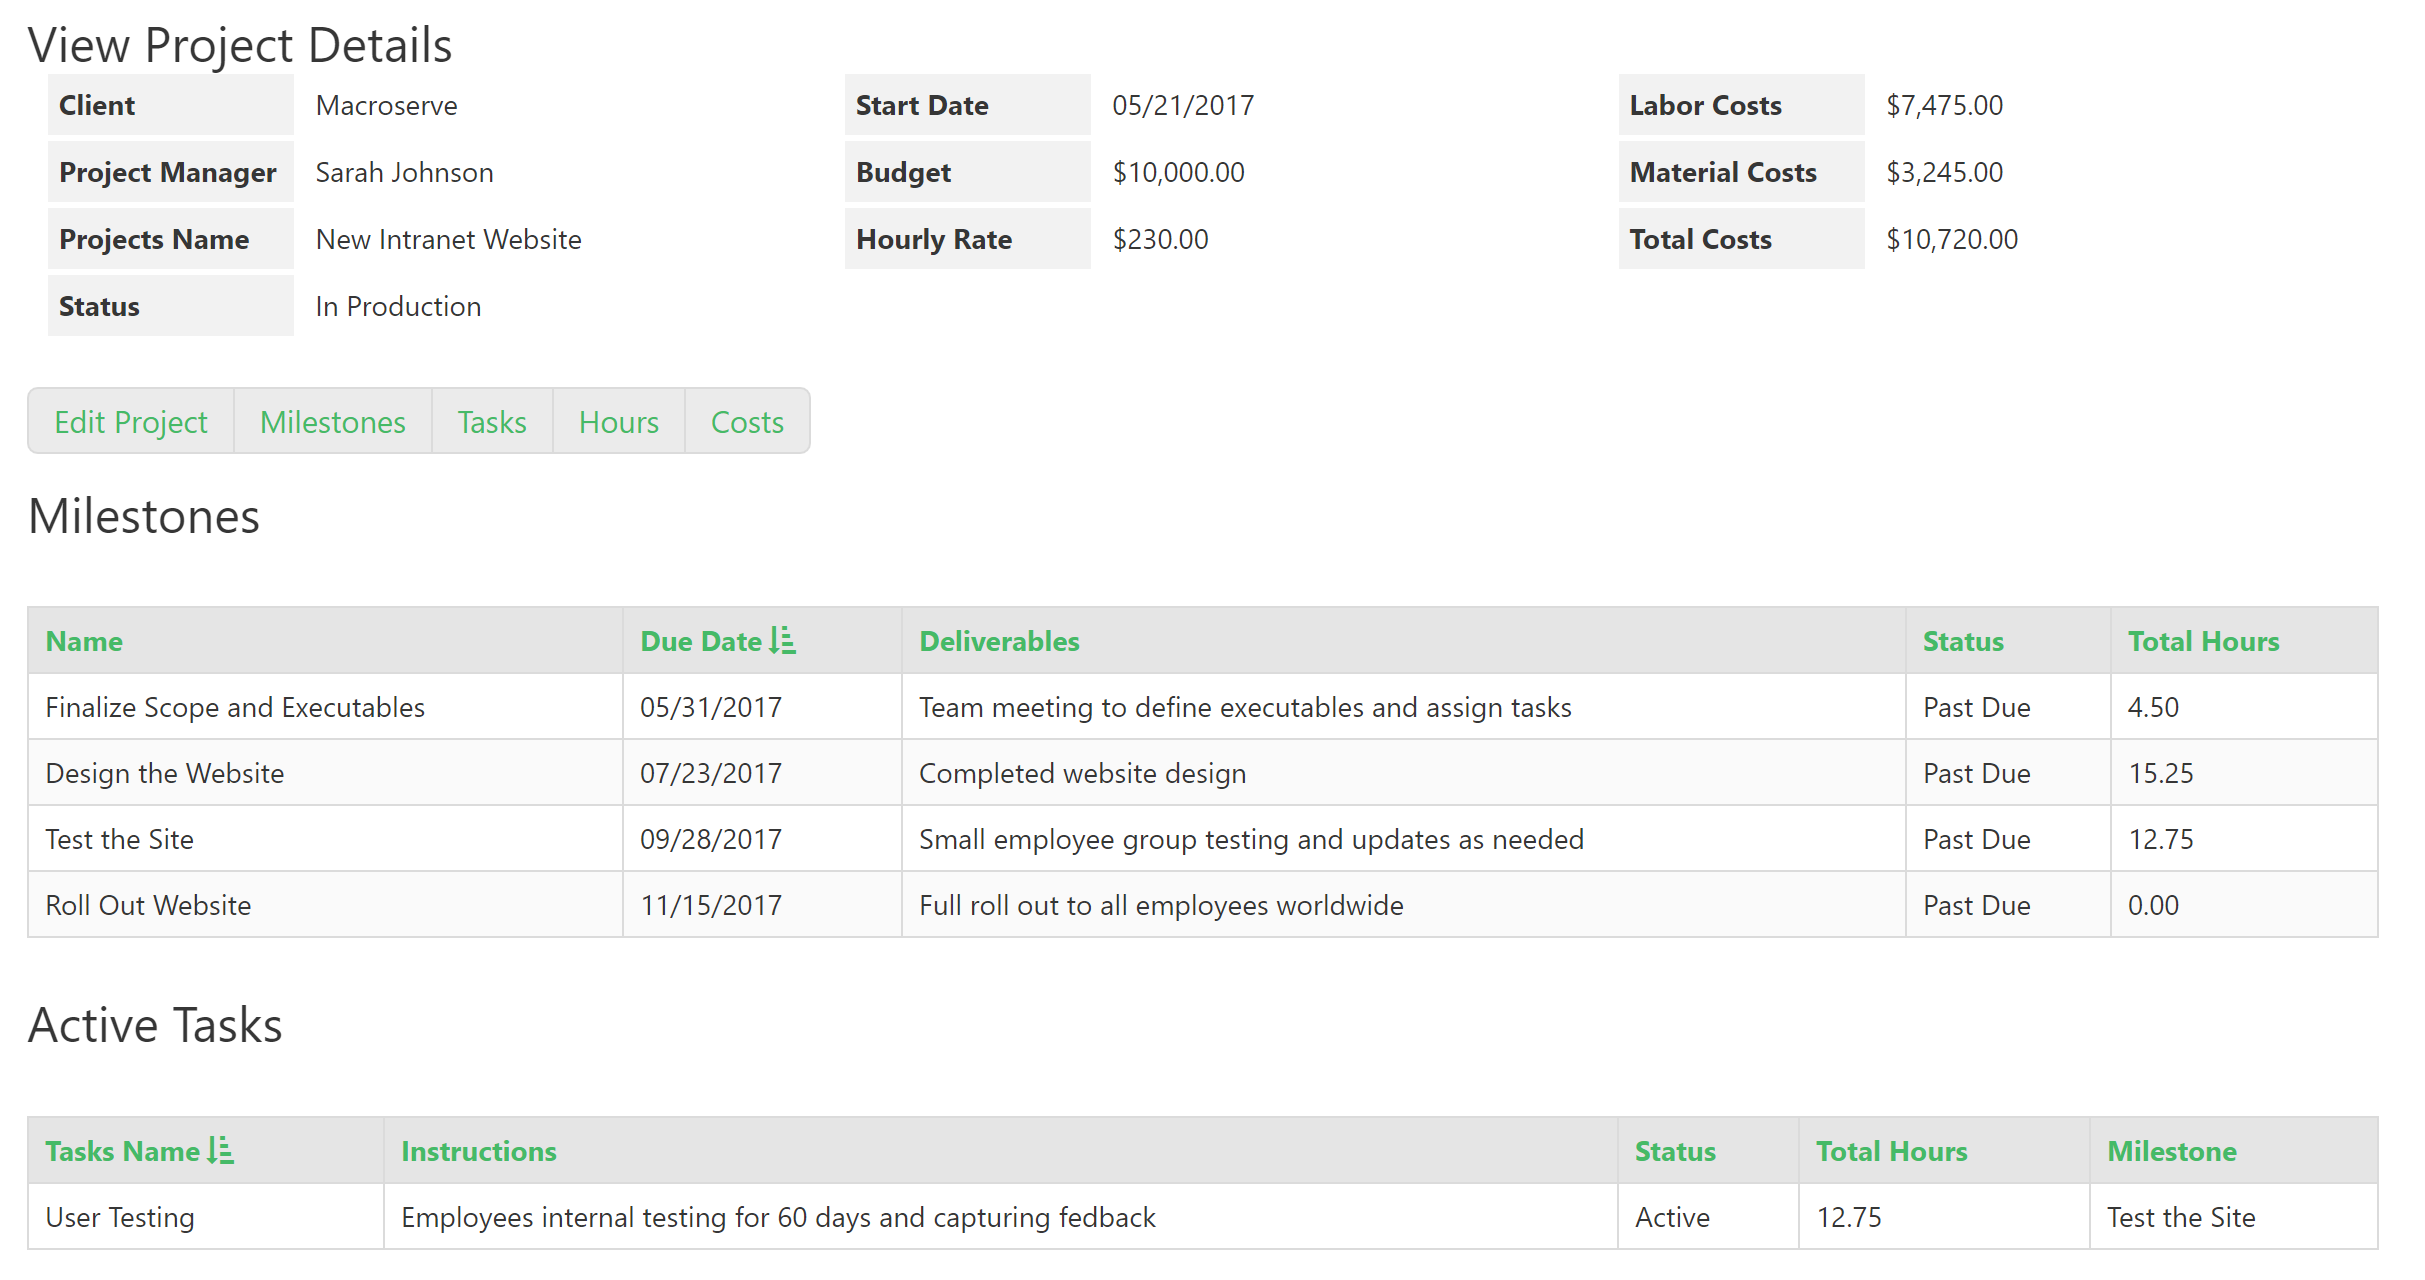
Automatically calculate the duration of each task in real-time as new instances of time spent are recorded in the Hours table.
-
The system will automatically calculate the total costs for a project, including labor and materials, in real-time as new records are added to the Hours and Costs tables.
-
Assign various tasks to different employees within a project, enabling each employee to have access to and make edits only to their assigned tasks.
Tip: Before you begin building your app, take the time to write down your tables, user roles, and fields, just as we have done here. Don't forget to make note of any special field formats.
This will help streamline your work and make it faster once you get into the Builder.
User Roles
Often, user roles become apparent as you go through the app planning process. As you consider who will be using your app and their specific tasks, you will start to identify different groups based on their roles and responsibilities.
Based on our app plan, we have identified three distinct user groups who will be utilizing the application - Administrators, Project Managers, and Employees.
Now, let's outline the user roles and the fields associated with each role:
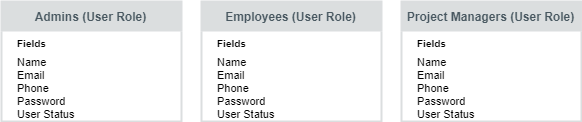
Each user group should have the ability to perform various tasks and access different types of records. When you begin building your Live App, you will create separate pages for each role.
These pages will provide views that enable users to efficiently complete their specific tasks.
Note: Users in this application have the flexibility to belong to multiple user roles simultaneously. While all users are assigned to the Employees role, a few users also have the additional roles of Admin and Project Manager.
Adding Your Tables, User Roles, and Fields
Finally, it’s time to start building!
Now, it's time to put your planning into action and add your tables, user roles, and fields to your app.
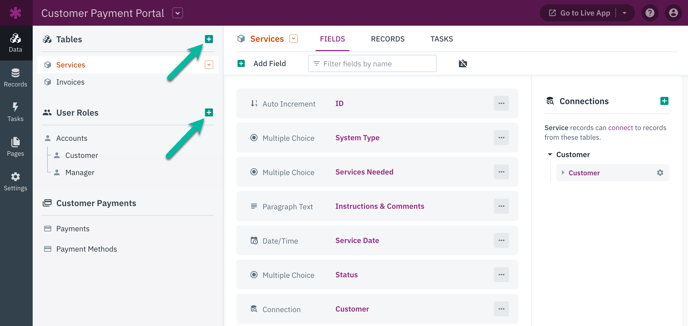
To add your tables and user roles, simply click on the "+" button located in the Data section of the Builder.
Tip: If you are adding user roles for the first time, you will need to activate them first. For instructions on activating user roles, see this article.
To add new fields, navigate to the table in the Data section of the Builder. Then, click on the "Add Field" button located in the top menu.
This action will open up a toolbox with various field options for you to choose from. Take some time to explore the different options available and select the field type that best suits your needs.
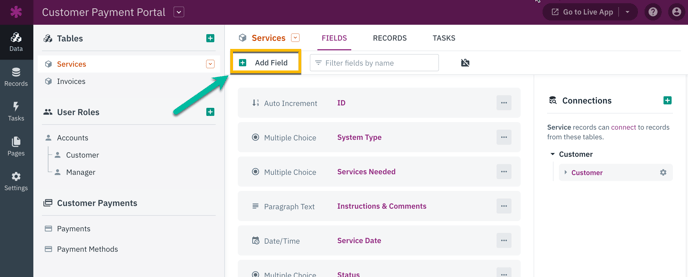
Next, select a field type and add it to your table. You will have the option to customize the field name right away.
Tip: To learn more about adding and editing fields, see our guide About Fields.
After you have added your tables and user roles to your app, the next step is to establish connections between them. If you need assistance with determining how to connect your tables, refer to our companion guides:
Tables vs. User Roles
In many applications, user roles are essential for enabling users to log in and access data. In Knack, user roles play a crucial role in controlling page permissions and managing access to your app.Suppose we're developing a customer portal. Which approach should we choose: creating a customer table or defining a user role?
The choice between creating a customer table or defining a user role depends on the nature of your business. If you operate in a business-to-consumer (B2C) scenario, your customers are individuals.
However, in a business-to-business (B2B) scenario, your customers are companies, each consisting of individuals who work there.
Ask yourself:
-
What kind of data am I working with?
-
Who needs to log in?
In a business-to-consumer (B2C) scenario, the customer's name, address, phone number, total spend, and other data points are all used to identify an individual. This individual needs to log in to view their orders, update their information, and perform other actions.
Therefore, it is necessary to create a user role specifically for customers.

In a business-to-business (B2B) scenario, there are two types of data to consider. Firstly, there is the information about the customer's company, such as the company name, address, phone number, and total spend.
This data helps identify the company. Secondly, there are contacts within that company. Each contact has their own set of information, including their name, email address, phone number, and job title.
In this particular situation, it is recommended to create a table for Customers and establish a user role for Contacts. This approach ensures that Customers represent the company data, as companies themselves cannot log in.
Contacts, on the other hand, represent the data of the individuals who work at the Customer companies and require the ability to log in.
Note: If you are developing an app for internal use only, without the intention of allowing customer access, there is no need to create a user role. However, if you anticipate the possibility of opening up the app to customers in the future as a portal, it is recommended to establish a user role for customers from the start, as tables cannot be converted into user roles.
You have the flexibility to delay granting them login access or creating passwords initially.
Optional Functionality
Sharing Data Between Tables in Views
In certain situations, you might find it useful to display the data from one table in the views of another table.
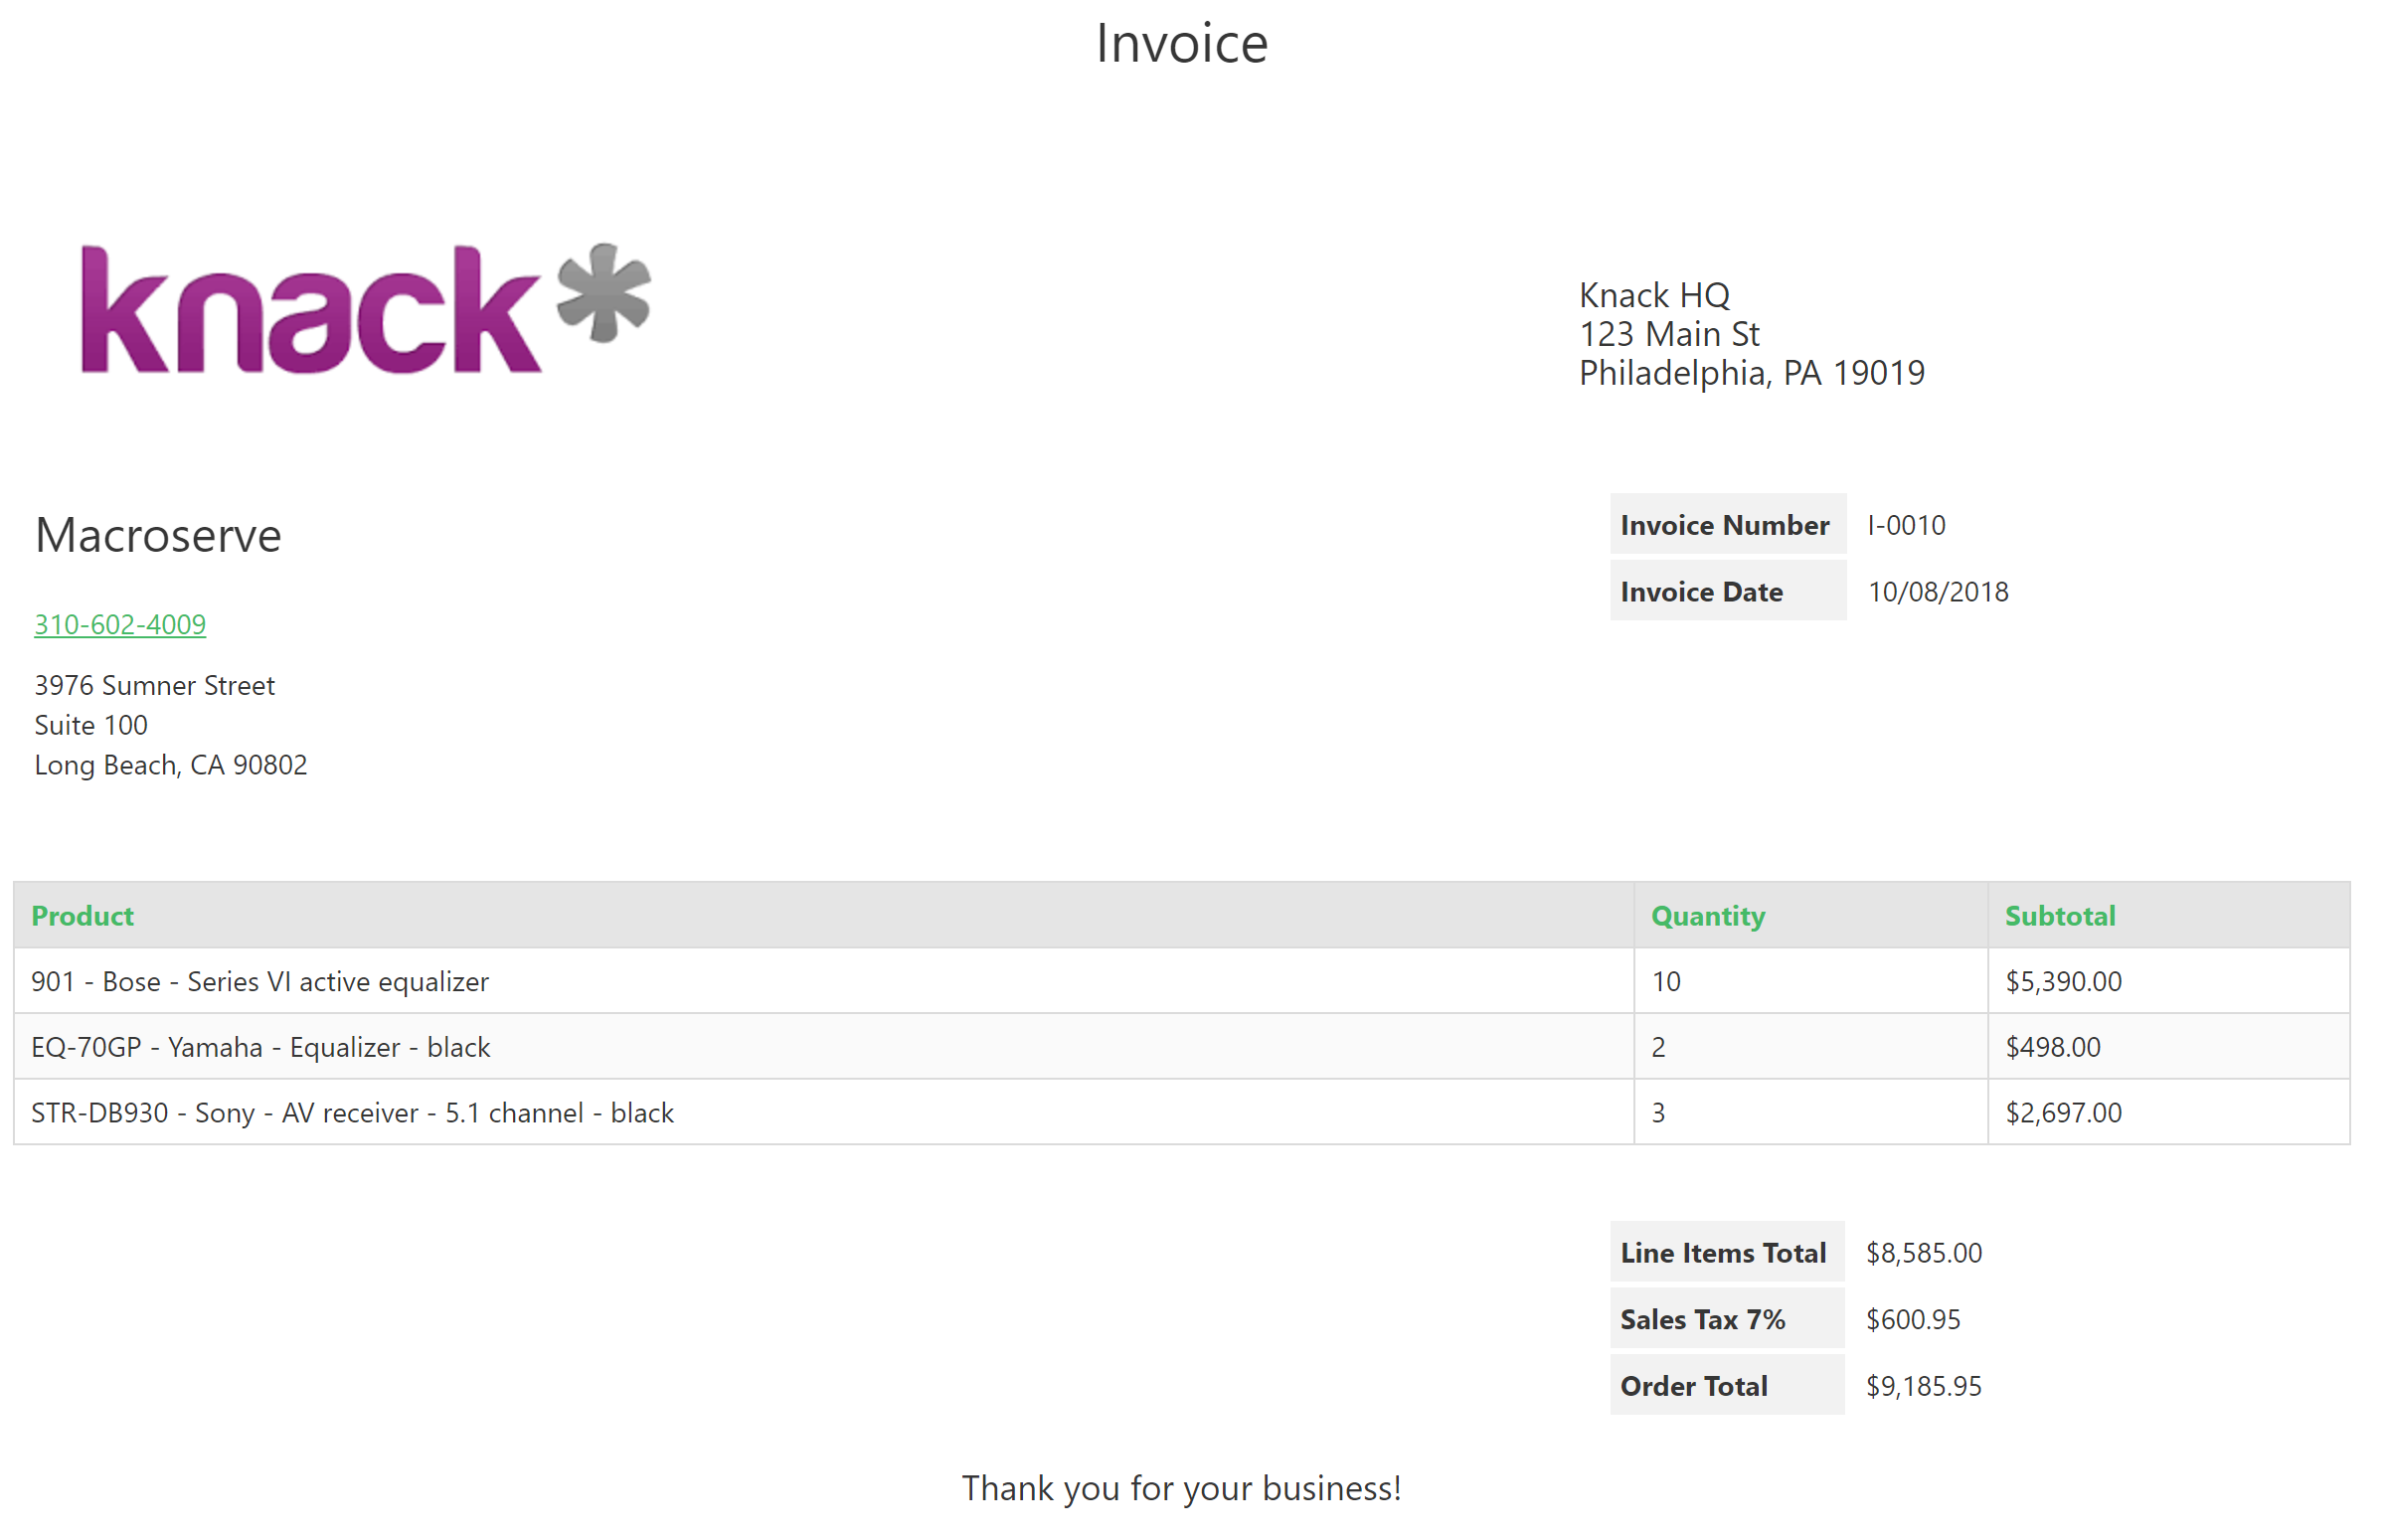
As an example, in a customer portal, we utilize tables for Invoices and Customers. On our Invoice page in the Live App, we aim to incorporate Customer fields such as the name and address.
You can combine fields from connected records in views, allowing you to display customer details on the invoice page itself.
Tip: See this guide for instructions: Combining Fields From Connected Records in Views
Sharing Data Between Tables on Records
In certain situations, it may be necessary to store the same field's data in multiple tables in order to activate rules or specific workflows.
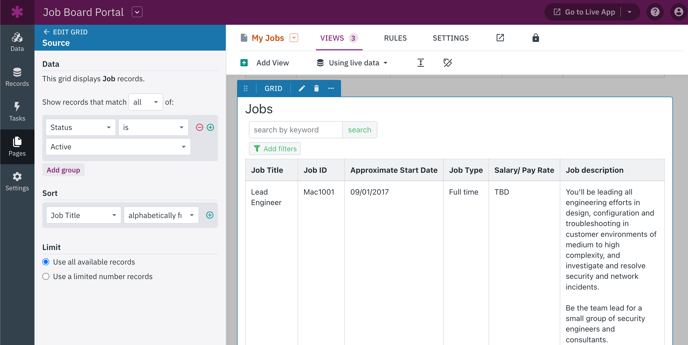
For instance, in the case of a job portal, businesses have the option to pay a membership fee to showcase their job listings. If they fail to make the payment, the job postings will not be visible on the job seeker pages.
Creating a status field on both the Businesses and Job Listings tables requires manually maintaining the current status of a business in multiple places, including the Business record and each connected Job Listings record.
This additional effort can be streamlined by implementing a text formula or equation in the Job Listings table. This will automatically retrieve the status value from the connected Business, saving you time and reducing manual work..
Consequently, the status field, which serves to identify the Businesses table, is exclusively situated on the Businesses table itself.
By utilizing the text formula, the status of the connected business is effortlessly kept up-to-date on every connected Job Listings record, eliminating the need for any additional effort on your part.
Next, we have the option to configure source filters in our Live App, allowing us to exclusively showcase Job Listings records where the corresponding business status is active.